Hi All
Nice to have the forums back up again - thanks Tezza

It has been a while, but I've still been working on this. Been hell busy at work and my wife has been ill, unfortunately. Anyway, here's a long and detailed analysis of progress with a summary at the top.
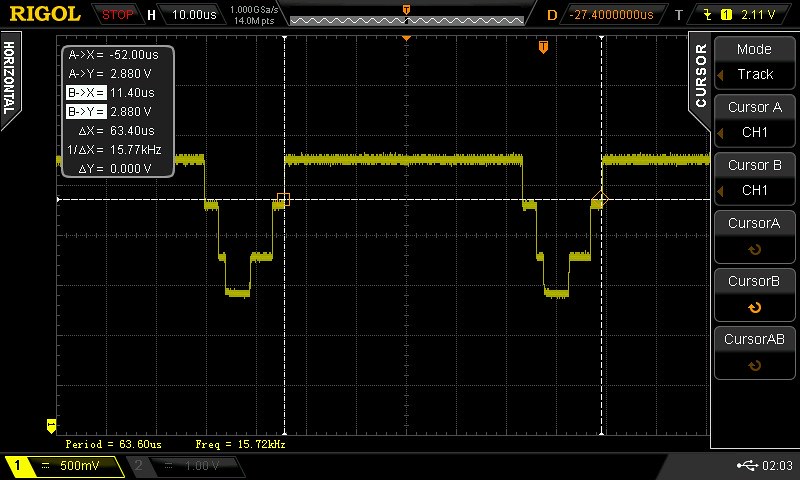
SummaryI can now make sense of the TMS9929A datasheet and the voltage levels for Y, B-Y, and R-Y. I know how they calculated the values in table 2-3 on page 2-17 of the datasheet (see earlier discussion above where the numbers didn't quite add up), and they fit with measurements taken on the Rigol 1052E oscilloscope I bought off Natshaw. That scope is a very cool piece of kit - love it, thanks
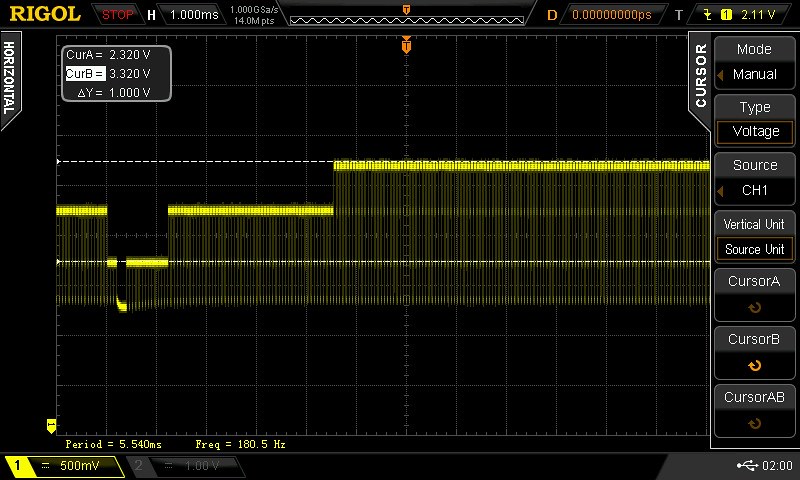
The TMS9929A Y output has a 1 volt range from the black voltage level to the white voltage level with the sync tip 0.44 volts below black. So we have 1.44v peak to peak which has to be scaled by approximately a factor of 0.7 to fit the standard voltage range for component video. The B-Y and R-Y outputs also appear to be based on a 1v peak to peak range (no horizontal sync). At the least these also need to be scaled by a factor of 0.7 to fit the standard voltage range for component video.
However empirical testing says that we need additional scaling, otherwise the B-Y signal is far too strong. I'm still not certain about the correct scaling factor to apply to the TMS9929A VDP B-Y and R-Y outputs to get a natural colour balance, but I have a much better understanding of component video now and I have some ideas about what to try next.
There is a good Texas Instruments document that suggests how to build circuits for interfacing the TMS99XXA to composite and RGB monitors, and under RGB it talks about dividing B-Y by 2.03 (ie. multiply by 0.493) and dividing R-Y by 1.14 (ie. multiply by 0.877)
http://spatula-city.org/~im14u2c/vdp-99 ... nitors.pdfThat is consistent with comments in
http://m.broadcastengineering.com/infra ... deo-basicsIt strikes me that it *may* be critical to perform DC restoration on the signal prior to scaling, and that *may* be the reason for the poor colour balance, because the DC offset will be altered for the B-Y channel in relation to the Y channel as we scale the B-Y channel by more than the Y channel. That may result in issues for the TV sets as they try to determine the zero level of the incoming component signals.
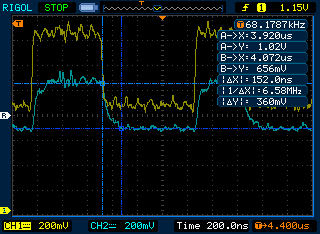
Here are some useful voltage measurements for reference:
Vwhite = 3.34v
Vblack = 2.36v (so approx 1v from Vblack to Vwhite)
Vsync = 1.92v (so Y channel is approx 1.44v peak to peak)
Vno_color = 2.80v (B-Y) or 2.84v (R-Y)
Vb-y 100% = 3.32v
Vr-y 0% = 2.38v
Note - I have NOT measured Vb-y 7% (from a dark yellow screen) or Vr-y 93% (from a medium red screen) yet
Analysis:I've figured out how the TMS9929A voltage specs and colour assignments in Table 2-3 of the TMS99XXA manual work. This is the table that Natshaw referred to earlier:
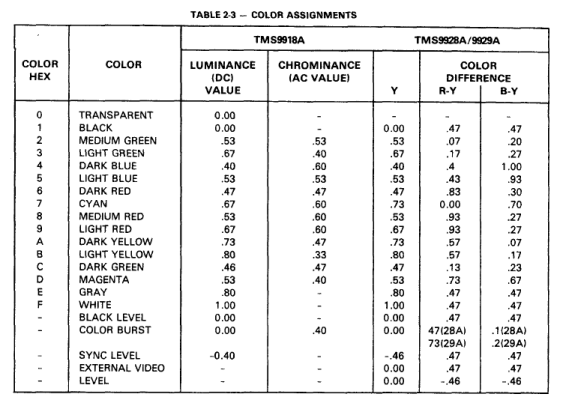
We couldn't figure out how those colour difference voltage levels added up before. Check out the table below for the answer.
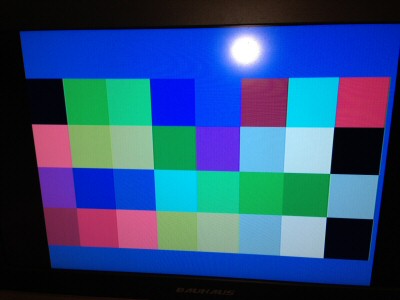
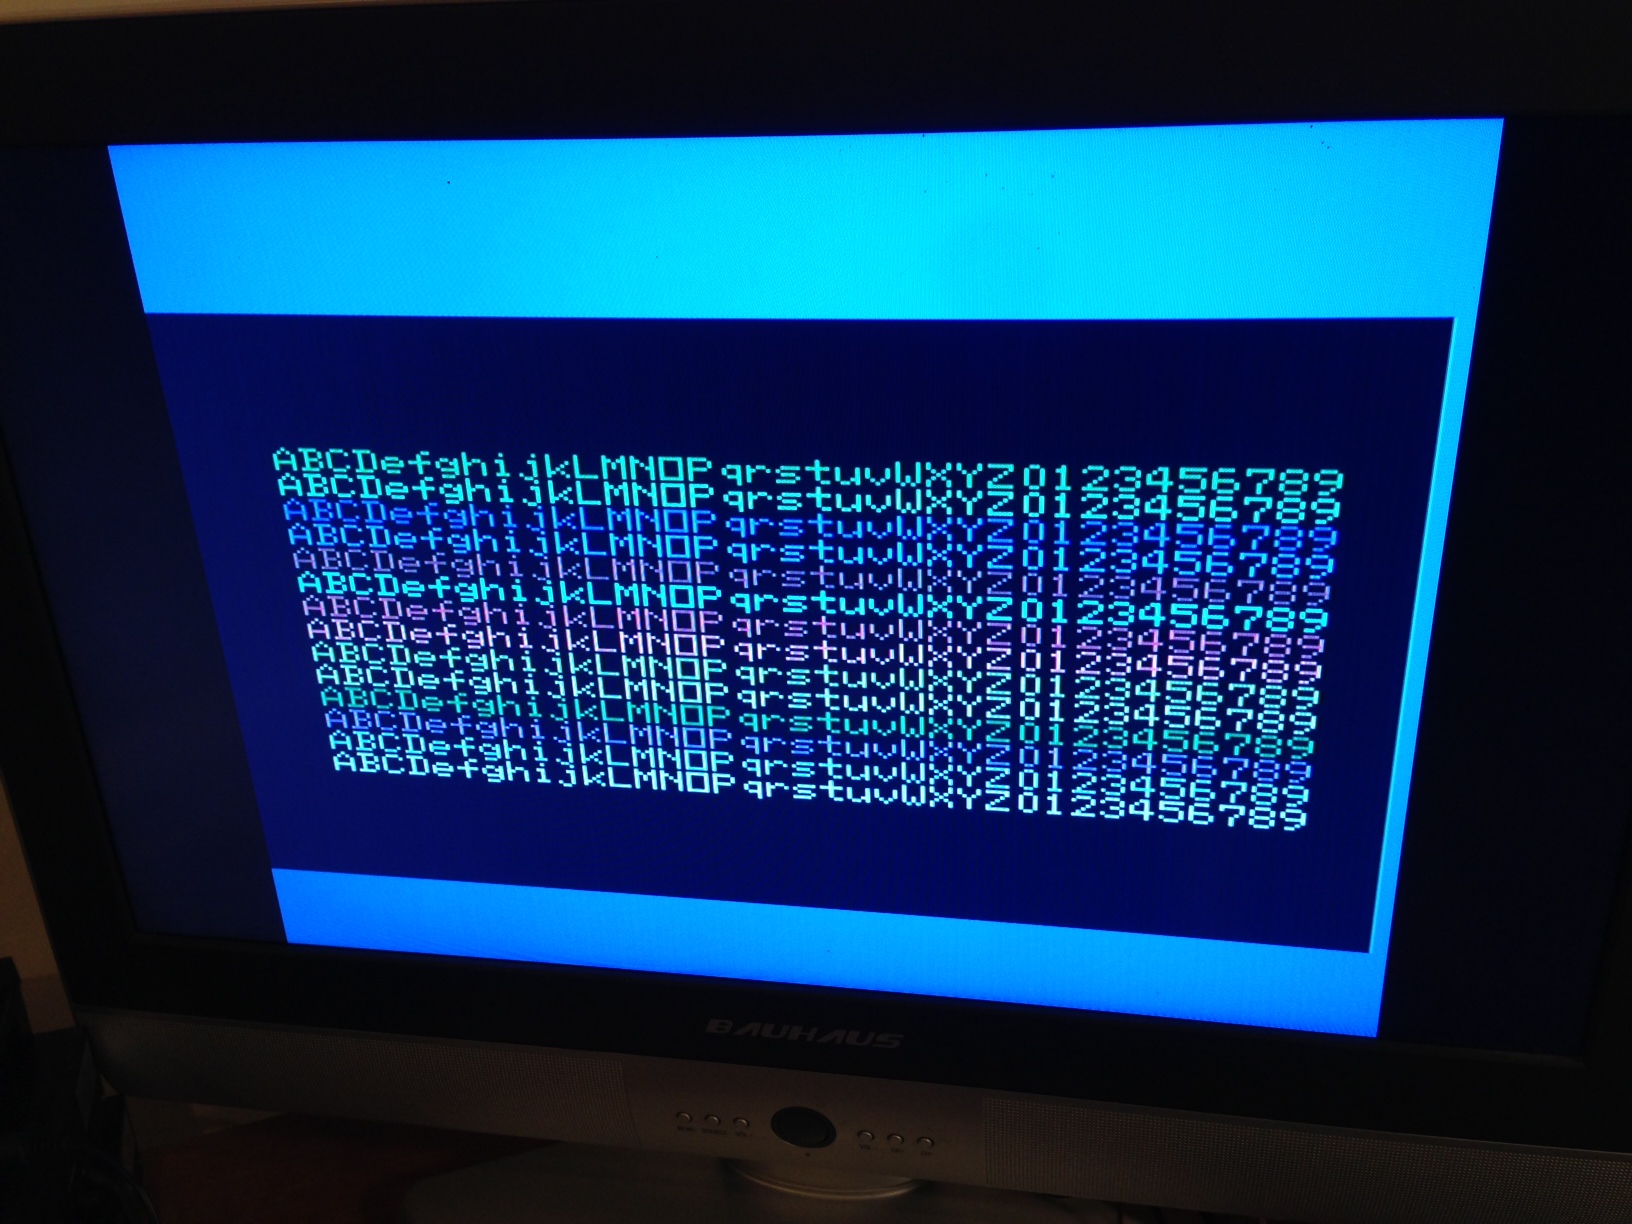
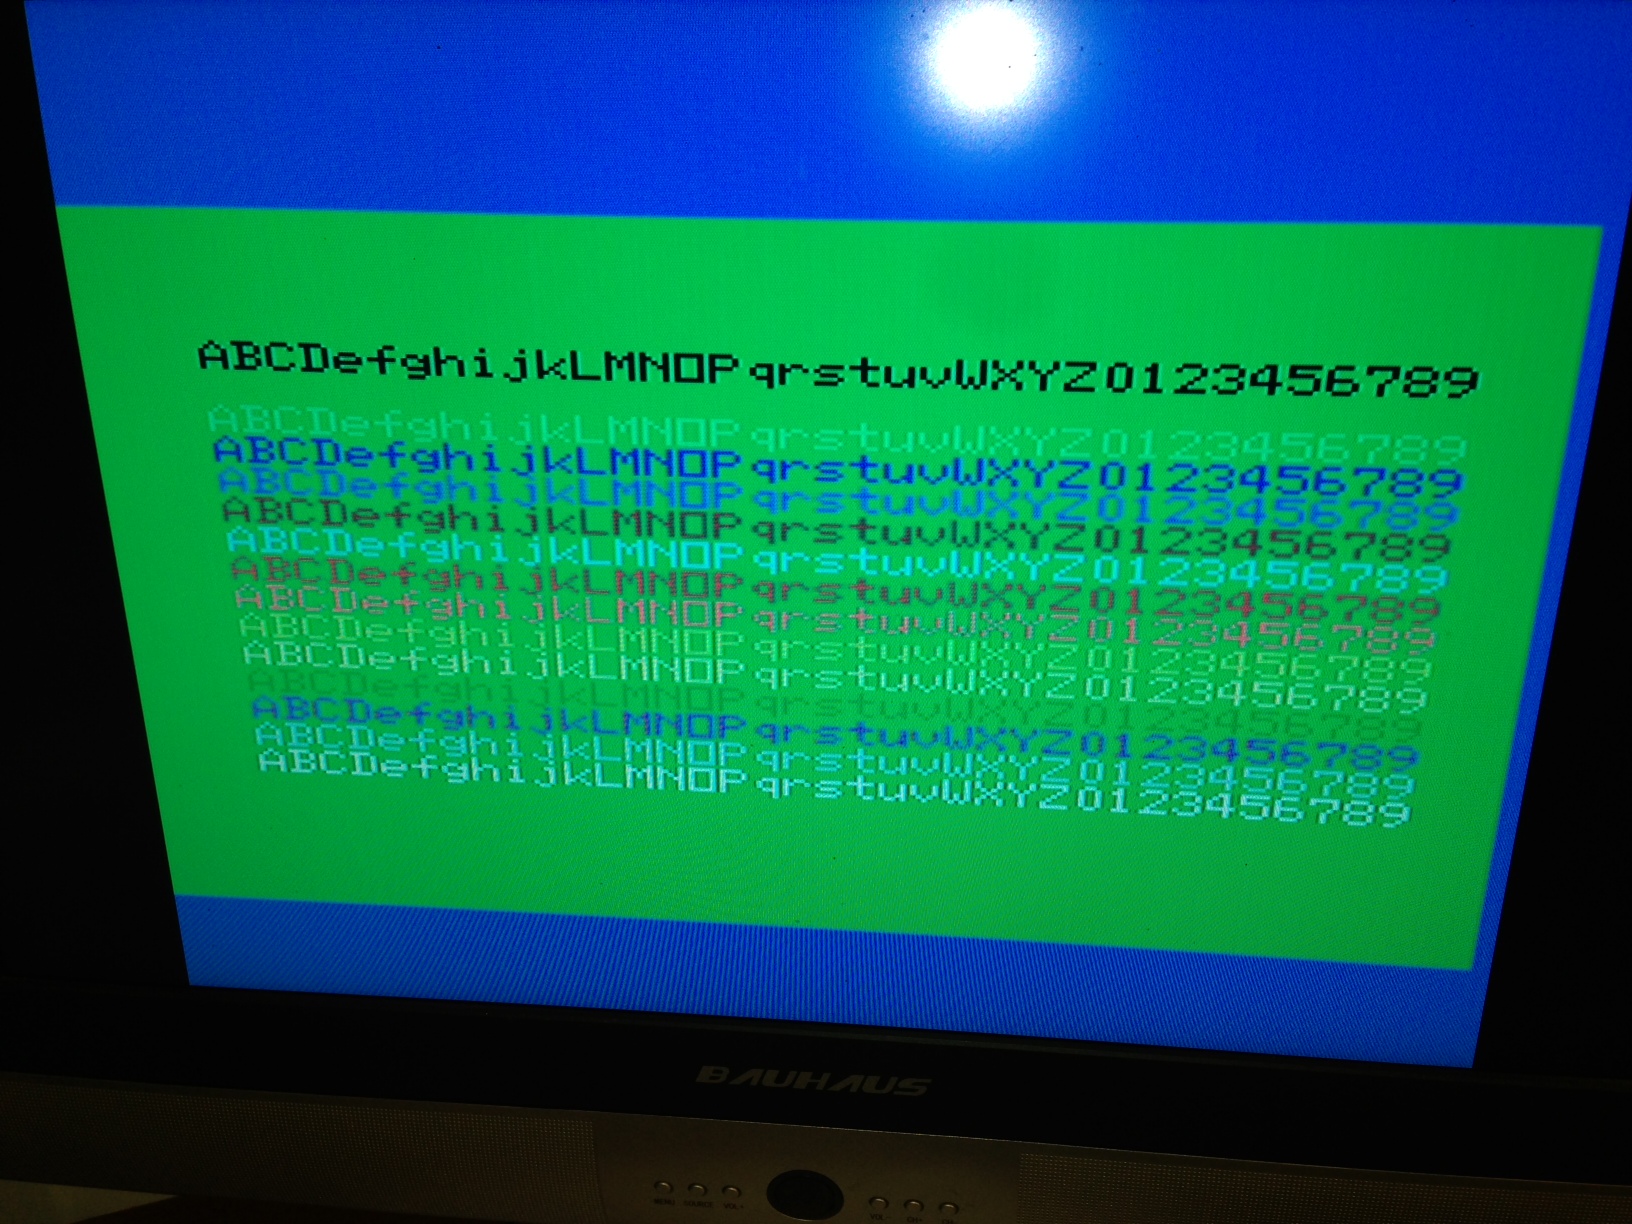
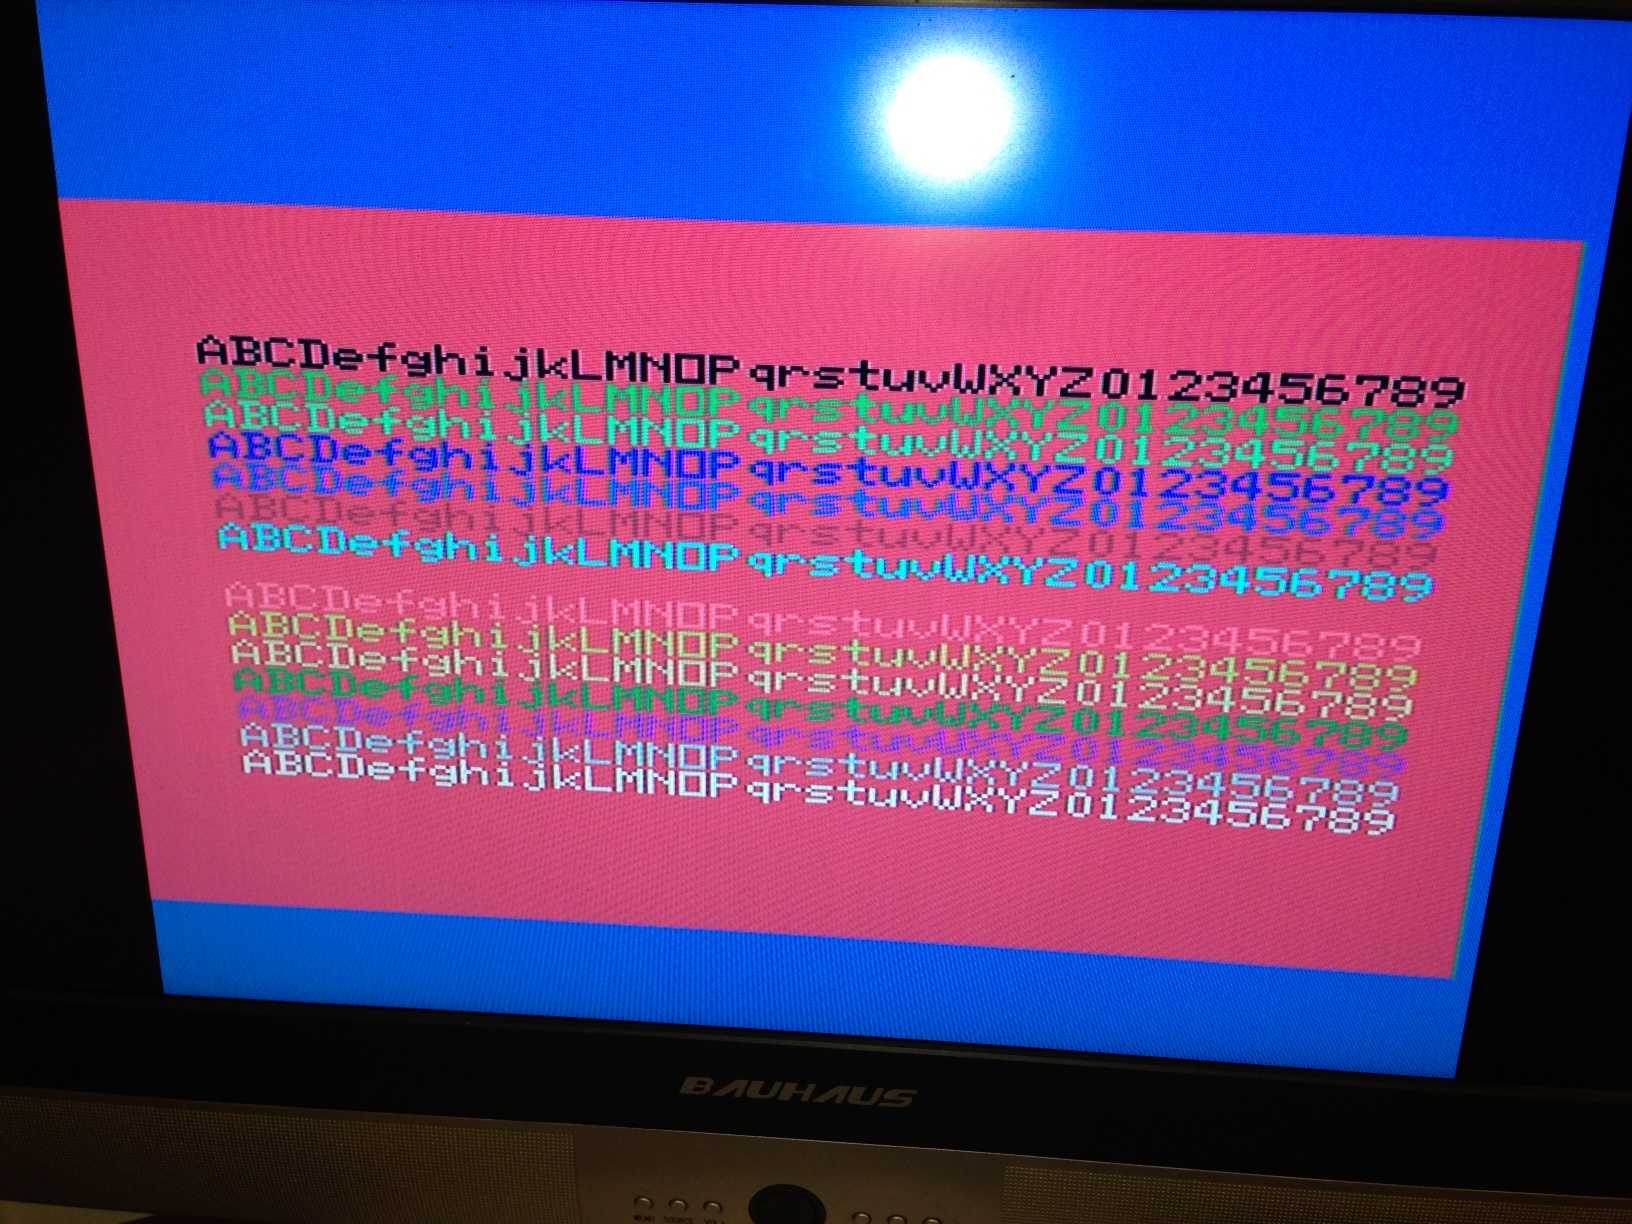
I started with the colour levels that the MESS emulator uses. I figured these should be pretty close to accurate as there have obviously been some very talented people working on that over the years. I took a screenshot of my colour test screen and grabbed the RGB values (0..255). I then scaled those to the range of 0 to 1 by dividing by 255 (see R' G' B' columns below).
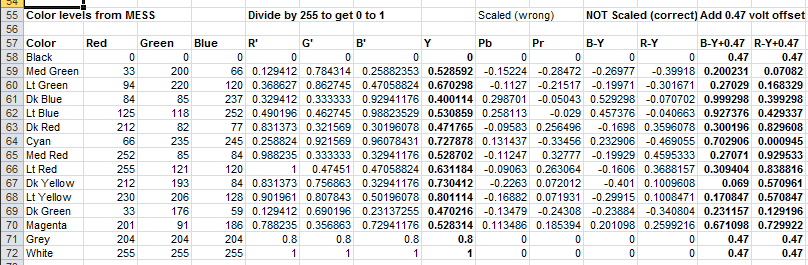
We then look at the standard colour difference transformations.
Y = 0.299R' + 0.587G' + 0.114B'
Those all match the Y value from Table 2-3 above apart from Light Red, which is slightly out. So either the emulator writers made a mistake, or the TMS99XXA datasheet has an error. I don't know which.
The Pb / Pr columns above use the SCALED transformations where Pb / Pr are mapped to a range of -0.5 to + 0.5. That is what Natshaw tried earlier. But that is NOT what the TMS9929A outputs. The TMS9929A outputs B-Y and R-Y, which is the UNSCALED transformation where B-Y ranges from +/- 0.886 and R-Y ranges from +/- 0.701. So:
B-Y = -0.299R' - 0.587G' + 0.886B'
R-Y = 0.701R' - 0.587G' - 0.114B'
You then offset that by 0.47v and the values match the color difference columns of Table 2-3 exactly (apart from Light Red for which either the MESS emulator or the TMS99XXA documentation is wrong). The offset is there because these are colour differences, and the difference can be either positive or negative. So that 0.47v offset just sticks all the B-Y and R-Y voltages in a nice 1 volt range with the middle of the range around 0.47v above the black level.
ie. in the spreadsheet above, the Y column, B-Y+0.47 column, and the R-Y + 0.47 column all match the contents of Table2-3 above
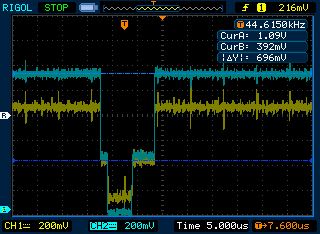
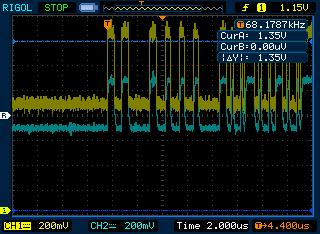
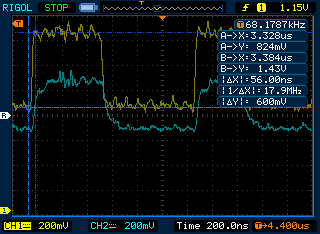
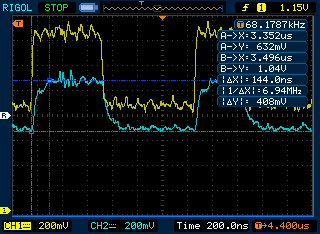
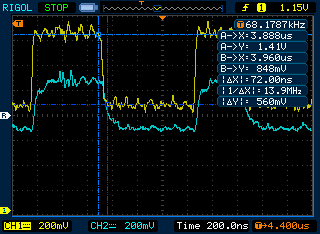
So now we understand the calculations in the TMS9929A documentation. Those seem to fit reasonably well with observing the actual voltage levels. The oscilloscope has been brilliant for that. Here are some useful numbers:
Vwhite = 3.34v
Vblack = 2.36v
Vsync = 1.92v
Vno_color = 2.80v (B-Y) or 2.84v (R-Y)
Vb-y 100% = 3.32v
Vr-y 0% = 2.38v
Note - I have NOT measured Vb-y 7% (from a dark yellow screen) or Vr-y 93% (from a medium red screen) yet
The difference in voltage levels from black to white is very close to 1 volt for both the Y and B-Y outputs, which is what it is supposed to be according to the TMS9929A documentation (I haven't verified the voltage range for the R-Y output yet). And the horizontal timings (eg. length of sync pulse, front porch, back porch etc). match the TMS9929A specs almost exactly.
So the output is almost exactly 1 volt peak to peak for the Y, R-Y, and B-Y channels, with -0.44v for the sync signal. That scales nicely down to the European standard of 0.7v peak to peak for the signal plus 0.3v for the sync like so:
1 / 1.44 = 0.694v (for signal) and 0.44 / 1.44 = 0.305v (for sync).
That is close enough to correct allowing for some measurement errors. So we need to adjust our voltage dividers for the luminance channel to hit a 1/1.44 = approx 0.7 multiplier on the original signal level. That is close to the value of 0.744 I came up with empirically on page 4 of the classic computers thread (ie. by turning the trimpot until I got the best balance I could get).
But what about the other two channels? A 0.7 multiplier would also adjust them to 700mV peak to peak. But that isn't consistent with my earlier empirical testing. There I had a 0.41 multiplier on B-Y and 0.71 multiplier on R-Y. And we know from 5-11under's work and my own testing that the B-Y channel is 'too strong' by default.
So that's the final bit of the puzzle. I'm not sure how we are 'supposed' to scale the TMS9929A B-Y signal to meet the correct range for component video input. I've read a number of articles regarding additional scaling factors for B-Y and R-Y, but I'm not yet sure how they apply.
eg. Take a look at
http://m.broadcastengineering.com/infra ... deo-basicsThat suggests that NTSC / PAL has a 0.493 scale factor on B-Y and 0.877 on R-Y, and EBU-N10 has a 0.564 scale factor on B-Y and 0.713 on R-Y. But I'm not sure exactly at what point you are supposed to apply those factors, nor whether it means that you calculate B-Y and R-Y as above then just multiply again by these factors.
So... I will probably try a couple of approaches. I will try setting the trim pots that feed my THS7314 to values based on the above, then turn the computer on and see what the output looks like.
(As an interesting side note, the early voltage levels used for monochrome composite video had 1.4v peak to peak with 1v for the luminance and -0.4v for the sync. It was later reduced to 1v peak to peak including sync for NTSC, but the 10:4 ratio between signal and sync was kept, which is why NTSC has 714mV peak to peak for the signal and -286mV for the sync. The Europeans decided to make their lives easier by standardizing on a 7:3 ratio which is where the 700mV and -300mV for sync comes from. See attached VideoStandardOverview.pdf for some background reading on that, and the Engineer's Guide to Decoding and Encoding has some interesting material too.)
Measurements for future referenceRemember there will be slight measurement errors in these, but they confirm the TMS9929A specs quite nicely.
Screen set to white (color 15, 15) Y Active = 3.34v
Y Back Porch / Front Porch = 2.36v
Y Sync = 1.92v
B-Y Active = 2.80v
B-Y No Color = 2.80v
B-Y Vneg (color burst) = 2.52v
R-Y Active = 2.84v
R-Y No Color = 2.84v
R-Y Vpos (color burst) = 3.12v
Based on 1v peak to peak, TMS9929A specs predict
Y = 2.36v + 1v = 3.36v (close enough - measured as 3.34v)
B-Y = 2.36v + 0.47v = 2.83v (close enough - measured as 2.80v)
R-Y = 2.36v + 0.47v = 2.83v (close enough - measured as 2.84v)
Screen set to black (color 1,1) Y Active = 2.38v
Y Back Porch / Front Porch = 2.38v
Y Sync = 1.92v
B-Y Active = 2.80v
B-Y No Color = 2.80v
B-Y Vneg (color burst) = 2.52v
R-Y Active = 2.84v
R-Y No Color = 2.84v
R-Y Vpos (color burst) = 3.12v
Based on 1v peak to peak, TMS9929A specs predict
Y = 2.38v + 0v = 2.38v
B-Y = 2.38v + 0.47v = 2.85v (close enough - measured as 2.80v)
R-Y = 2.38v + 0.47v = 2.85v (close enough - measured as 2.84v)
Screen set to cyan (color 1,7) Y Active = 3.08v
Y Back Porch / Front Porch = 2.36v
Y Sync = 1.92v
B-Y Active = 3.02v
B-Y No Color = 2.80v
B-Y Vneg (color burst) = 2.52v
R-Y Active = 2.38v
R-Y No Color = 2.84v
R-Y Vpos (color burst) = 3.12v
Based on 1v peak to peak, TMS9929A specs predict
Y = 2.36v + 0.73v = 3.09v (close enough - measured as 3.08v)
B-Y = 2.36v + 0.70v = 3.06v (close enough - measured as 3.02v)
R-Y = 2.36v + 0v = 2.36v (close enough - measured as 2.38v)
Screen set to dark blue (color 1,4) Y Active = 2.76v
Y Back Porch / Front Porch = 2.36v
Y Sync = 1.92v
B-Y Active = 3.32v
B-Y No Color = 2.80v
B-Y Vneg (color burst) = 2.52v
R-Y Active = 2.76v
R-Y No Color = 2.84v
R-Y Vpos (color burst) = 3.12v
Based on 1v peak to peak, TMS9929A specs predict
Y = 2.36v + 0.4v = 2.76v (exact)
B-Y = 2.36v + 1.0v = 3.36v (close enough - measured as 3.32v)
R-Y = 2.36v + 0.4v = 2.76v (exact)
Screen set to light green (color 1,3) Y Active = 3.02v
Y Back Porch / Front Porch = 2.36v
Y Sync = 1.92v
B-Y Active = 2.58v
B-Y No Color = 2.80v
B-Y Vneg (color burst) = 2.52v
R-Y Active = 2.56v
R-Y No Color = 2.84v
R-Y Vpos (color burst) = 3.12v
Based on 1v peak to peak, TMS9929A specs predict
Y = 2.36v + 0.67 = 3.03v (close enough - measured as 3.02v)
B-Y = 2.36v + 0.27v = 2.63v (close enough - measured as 2.58v)
R-Y = 2.36v + 0.17v = 2.53v (close enough - measured as 2.56v)
